Stop and Target Hit in the Same Candle: TradingView Checks
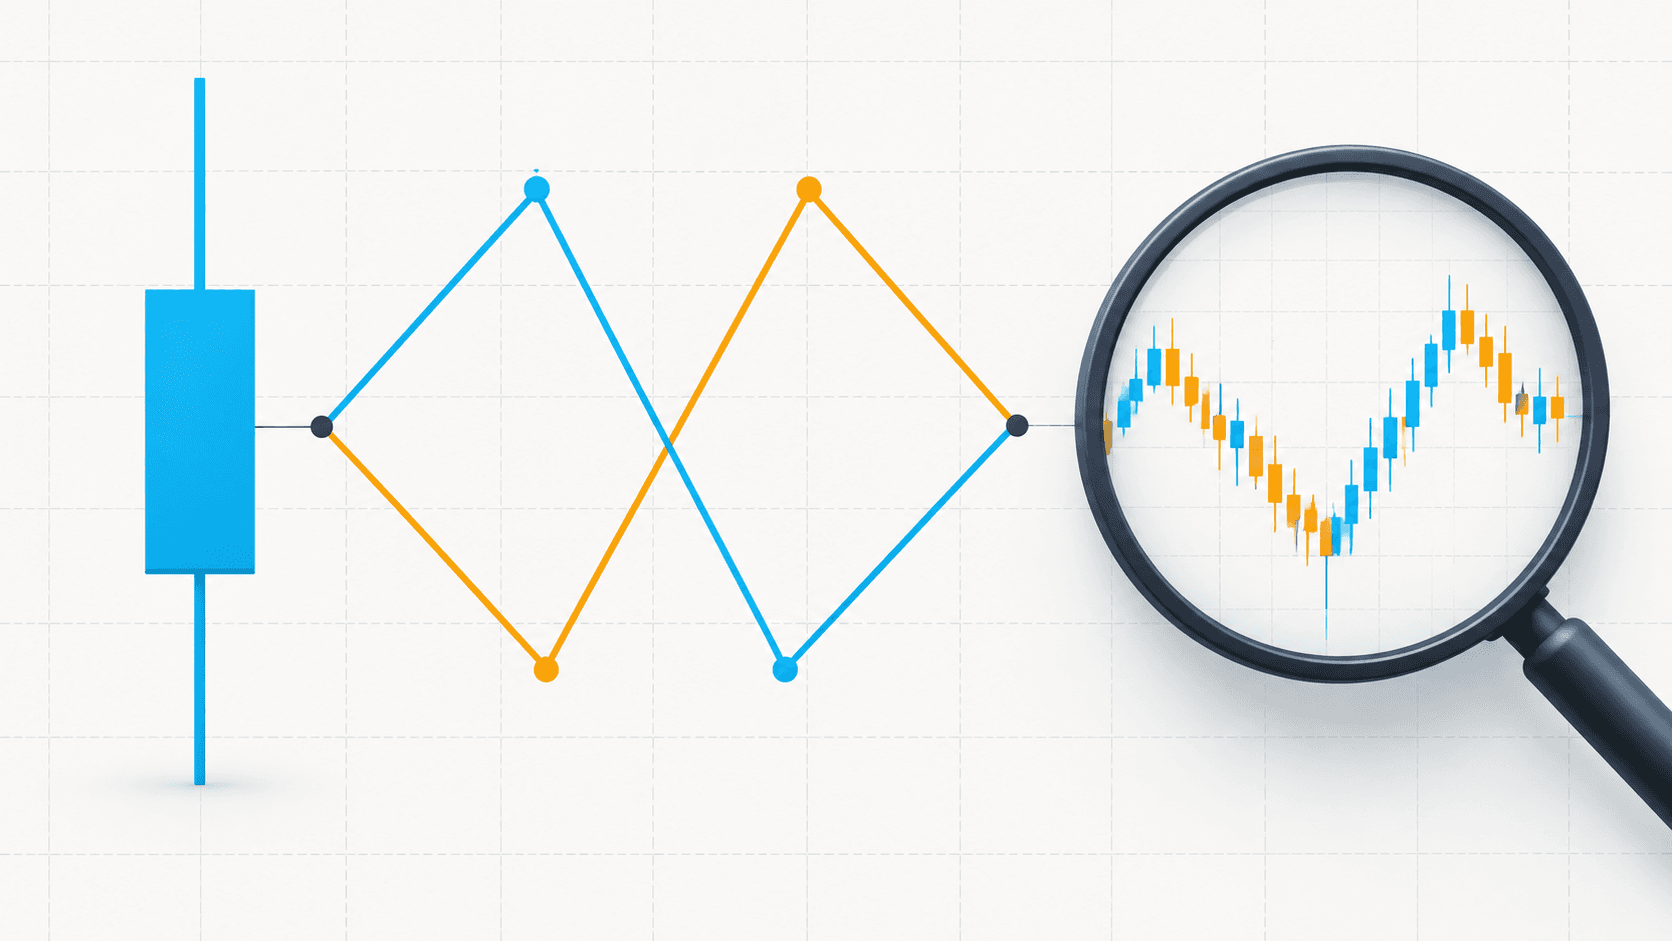
If a historical candle crosses both your stop and your profit target, its shape alone cannot tell you which exit should win. You need to know when the position opened, when each exit became active, and the price sequence after that point. A green candle can contain a stopped-out long trade; a red candle can contain a profitable one.
This guide isolates that same-candle problem in TradingView strategy testing. The worked prices and results below are invented examples, not AORDS trades or recommendations. The aim is a reproducible investigation rather than a more attractive equity curve.
What one candle tells you, and what it leaves out
A standard candle summarizes four prices: open, high, low and close. It does not preserve every movement between them. Consider this hypothetical five-minute MNQ candle:
Open: 20,004
High: 20,025
Low: 19,985
Close: 20,015
Assume one long contract was already open at 20,000 before the candle began. A fixed stop at 19,990 and a fixed target at 20,020 were both active throughout the candle. Assume either exit fills completely at its specified level and cancels the other, with no fees, slippage, gaps or partial fills.
Two possible paths share exactly those four candle prices:
High first: 20,004 → 20,025 → 19,985 → 20,015. The target is crossed before the stop.
Low first: 20,004 → 19,985 → 20,025 → 20,015. The stop is crossed before the target.
The close is above the open in both cases. Candle color therefore cannot decide the trade. Neither can a screenshot with both exit lines drawn through the bar. The missing evidence is the ordering of events while the orders were active.
A small sequence change can produce a large result change
CME specifies a $2 multiplier per MNQ index point and a minimum outright price increment of 0.25 points, worth $0.50 per contract. See the official MNQ contract specifications.
In the high-first example, the target outcome is (20,020 − 20,000) × $2 = $40 before costs. In the low-first example, the stop outcome is (19,990 − 20,000) × $2 = −$20 before costs. The difference between the two modeled outcomes is $60 for one contract.
That $60 is a sensitivity to the assumed sequence. It is not an extra fee, an estimate of typical slippage, or an amount every same-candle trade will lose. Different entries, exits and quantities produce different differences.
For a deliberately simple audit example, suppose 100 trades include eight unresolved cases with these identical payoffs. If a report currently counts all eight as target exits, replacing only those outcomes with stop exits reduces the total by 8 × $60 = $480. This arithmetic holds all later trades and quantities fixed. A strategy with equity-based sizing, daily loss limits or re-entry rules needs a full rerun because one changed exit can alter subsequent decisions.
Check order timing before arguing about the fill
The original example deliberately starts with an existing position and active exits. Many real investigations fail because they skip those assumptions. A level being crossed before an order exists does not establish an executable trade.
TradingView's default broker emulator infers an intrabar path from chart OHLC. When the open is nearer the high, it assumes open–high–low–close; when nearer the low, it assumes open–low–high–close. Default newly created market orders ordinarily fill on the next available tick, often the next bar's open in a bar-close historical test. Different settings can alter calculation and fill timing. Check the current strategy documentation for the exact configuration you are testing.
Build a short timeline for the disputed trade:
When did the entry condition become known?
When did the strategy create the entry order?
When did the emulator fill that entry?
When were the stop and target created or updated?
Which eligible exit price occurred first after those orders were active?
Keep timestamps and order identifiers beside each answer. If an entry happens late in the candle, the earlier high may be irrelevant to its target. If a stop moves after entry, the final plotted stop line may not represent the stop that existed during the earlier part of the bar. Mark unanswered timeline entries as unresolved rather than filling them with hindsight.
Now change only the entry timing in the low-first path. Price falls from 20,004 to 19,985, then a long enters at 20,000 on the rebound. Its exits become active after entry, and price reaches the 20,020 target before later closing at 20,015. The earlier low cannot stop a position that did not yet exist. This hypothetical timeline assumes calculation and order settings that allow that intrabar entry and timely exit activation; it is not a claim about the default configuration.
Use Bar Magnifier as a controlled comparison
TradingView's Bar Magnifier uses lower-timeframe price data to add detail inside historical chart bars. Its chosen intrabar interval depends on the chart interval. It can change whether an entry and exit fit within the same chart candle. TradingView also documents a 200,000-lower-timeframe-bar limit, so older chart regions may lack the additional coverage. Read its Bar Magnifier explanation before interpreting the comparison.
Save a baseline report, then rerun the same test with the additional historical detail where your plan and interface support it. Keep the strategy version, symbol, contract treatment, session, dates, position sizing and costs unchanged. Record the exact setting used; interface labels can change.
Compare the disputed trades individually. Did an exit switch from target to stop? Did the exit move to an earlier candle? Did an entry disappear? Did later re-entry change? Each is a different finding. A total-profit comparison alone hides which mechanism changed the result.
Zoom into the matching lower-timeframe window and compare the entry and exit timestamps. If one smaller candle still contains both levels, that candle's OHLC alone retains an ordering question. Extra granularity narrows the uncertainty; it does not automatically reconstruct every exchange event or your order's queue position.
Keep execution settings separate from price-sequence checks
TradingView exposes separate settings for commission, slippage and limit-price verification. Slippage is specified in ticks for market and stop orders. Limit-price verification can require movement beyond a limit before a historical fill qualifies. These settings address different assumptions from the order of prices inside a candle. See TradingView strategy properties.
For a useful experiment, first isolate the disputed sequence. Then run separately labeled cost and fill-stress scenarios. Changing the timeframe, costs, entry rule and historical detail simultaneously makes a changed outcome difficult to explain.
Also distinguish recalculation from additional historical evidence. Enabling a setting that recalculates a strategy more often does not by itself prove the original market sequence or a broker fill. A polished report still needs an explicit account of what data and execution assumptions produced it.
A same-candle audit record you can reuse
For each disputed trade, save these fields together:
Identity: strategy version, exact symbol, contract or continuous-series settings, chart interval, session and timezone.
Evidence: chart-bar timestamp and OHLC, lower-timeframe source and coverage, plus screenshots with time axes visible.
Order timeline: creation, activation or modification, entry fill, exit fill, quantity and cancellation behavior.
Comparison: baseline outcome, higher-detail outcome, settings changed and the explanation for any difference.
Disposition: explained, still ambiguous, or requires code/data review.
Review every trade meeting your chosen ambiguity rule, rather than selecting only losing examples. An illustrative screening rule is “the bar overlaps both active exit levels while the position is open.” Treat it as a candidate list: moving exits and same-bar entries still need timeline review.
If the strategy's apparent advantage depends heavily on unresolved cases, describe that dependency before drawing conclusions. A pessimistic alternative can be a useful stress scenario, but it is not proof that every ambiguous trade actually stopped out. Preserve the original run and report both assumptions.
Frequently asked questions
Should I always count the stop first?
You can use stop-first treatment as an explicitly labeled conservative sensitivity test. Do not present it as observed history. The stronger next step is to obtain finer evidence and establish which orders were active.
Does a lower chart timeframe solve the issue?
It can reveal more of the price sequence, but changing the chart timeframe may also change the strategy's signals. Compare like with like. A diagnostic lower-timeframe view and a strategy rerun on a different timeframe answer different questions.
Can Bar Magnifier prove a live fill?
No. It refines a historical simulation. Actual execution needs order and fill records from the relevant broker or venue, with the correct contract, quantity and timestamps.
Put the finding in context
A same-candle audit explains a specific source of uncertainty. For the broader workflow, read TradingView Backtest vs Live Results. For the contract math, see NQ vs MNQ Contract Size and Position Sizing.
For current AORDS figures, use the historical performance page. The AORDS results are backtested and exclude commissions and slippage. This article does not establish which historical-detail settings produced that dataset.
Educational information only. Futures trading involves substantial risk. Simulated results and more detailed backtests do not guarantee future performance.
Get AORDS through Whop and follow the access instructions sent by email. Cancel anytime.
© 2026 AORDS. Trading involves risk. Past performance does not guarantee future results.